$SUNS $PFLT $ARCC $NMFC $FSC $MCC $GBDC $HRZN $TICC $SLRC $TCRD $FDUS $BKCC $AINV $MCGC $PNNT $GLAD $FULL $PSEC $HTGC $KCAP $ACAS
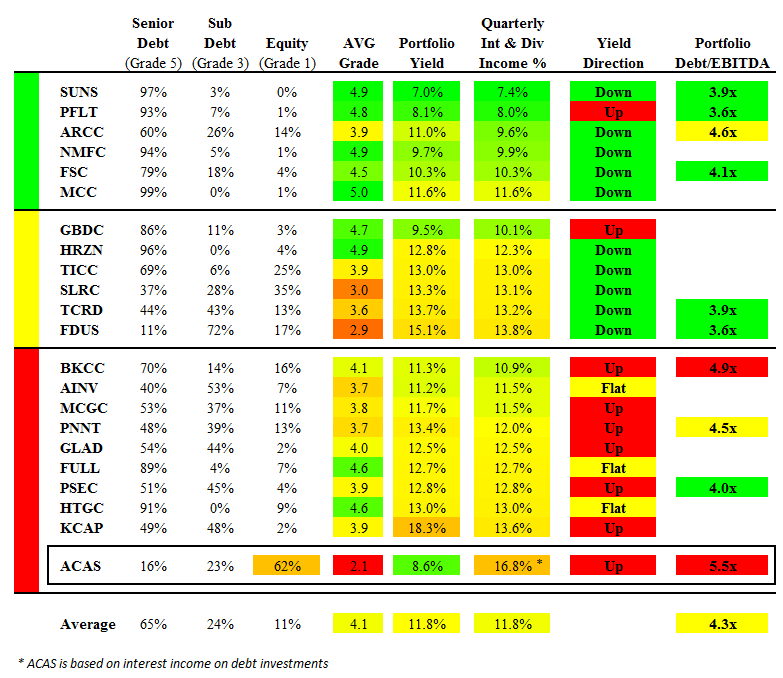
What we have here below is a chart that BDC Buzz put together that I linked to on seekingalpha.com. What is interesting to me is the averages. The average portfolio Yield is 11.8% and the average portfolio debt/ebitda is 4.3x. We can assume that on average these are stable businesses, I suppose just for the sake of maths.
For any company that has $1M in EBITDA, on average the debt is $4.3M and the annual interest payments on that debt are $0.507M. Means like an interest coverage ratio of 2.0x, on average.
I am used to seeing 3.1x-3.8x in Total Debt/EBITDA multiples with 2.2x-2.6x in Senior Debt/EBITDA multiples coming out with a total EV/EBITDA multiple of 5.9x-6.8x for generally stable businesses.
Note that Warren Buffettrecently did Heinz at TEV/EBITDA of 14X and SR. DEBT/EBITDA of like 6.5X and then Total Debt/ebitda if you include his preferreds at 10.2X that pay 9%.
Idearc was at 7.0x and RHD was at 9.0X in terms of debt/ebitda a few years ago.
Enjoyed this? Get more like it.
Glen's Musings — AI, investing, and building things. Occasional. Free.
Related Posts
- CANSO @ $384M of YPG 29.5% up from 24.2% $YLWDF $Y.CA $Y.TO
- $y.to $y.ca $DXM $LEE $GCI $NYT BIA/Kelsey Conf. how the impact of digital will be higher and faster and ways that it will beat their raised forecast
- $IMOS --- bad financial management, great execution EV/EBITDA 1.9x worth $40
- $CALL worth $20
- Yellow Media Road Show Presentation $Y $Y.CA $Y.TO $YLWDF
Keep Exploring
Glen's Track Record
Full performance history from 2008 to present.
Read moreCurrent Positions
What Glen actually owns — every ticker, every share class.
Read moreFanniegate: The Full Story
The largest fraud in American capital markets history.
Read more157 Billionaire Profiles
What the world's most successful people got right.
Read moreDisclaimer: This blog post reflects the author's personal opinions at the time of writing and is not financial, investment, or legal advice. Glen Bradford holds positions in securities discussed on this site. Past performance is not indicative of future results. Do your own research and consult qualified professionals before making investment decisions. Some content on this site was generated or edited with AI assistance.